

Since 2015, APTP’s Defund OPD committee has been leading the call to defund the police and invest in our communities. Our work has grown into the Defund Police Coalition with 13 BIPOC-led grassroots organizations* dedicated to refunding, restoring, and reimagining Oakland.
OPD takes almost HALF of Oakland's general fund each year, and that percentage has skyrocketed in the past two decades — consuming desperately needed resources from essential city programs and vital services.
The investment in policing has not made us safer. OPD remains an embarrassment to the city and a lethal threat to Oakland’s Black and Brown communities.
We can create safer communities if we are willing to have an openness to imagine and the financial investment to match.
* The Defund Police Coalition consists of the following groups: Anti Police-Terror Project, Arab Resource and Organizing Center, Asian Pacific Environmental Network, Bay Rising, Black Organizing Project, Causa Justa-Just Cause, Community Ready Corps, Communities United for Restorative Youth Justice, Critical Resistance, East Bay Alliance for A Sustainable Economy, Ella Baker Center, Oakland Rising, and the Urban Peace Movement.
How does OPD spend its time?
The Oakland Police Department, the Oakland Police Officers Association (OPOA), and neo-liberal electeds would have you believe that police will lose time to fight violent crime if their budget is cut.
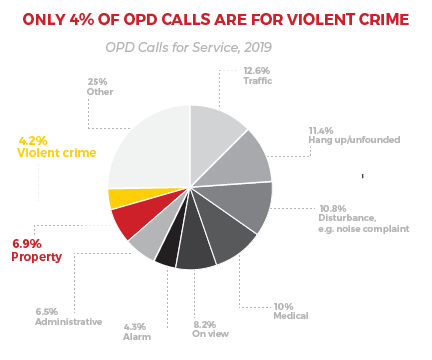
The Anti Police-Terror Project commissioned a study by AH Datalytics to analyze how the Oakland Police Department spends its time. Below is a list of key findings.
Violence: The violent crime category made up 4.2% of all calls using the National Incident Based Response System Definition.
Medical: Medical Calls for Service added up to 10% of total calls (44,231) at a median of just under 42 minutes of time spent per call. This category includes:
Medical (5.7%)
Mental Health (2.8%)
Suicide (0.4%)
Welfare Check (1.4%)
Traffic: 12.6% of all calls for service are related to traffic.
3.8% of those calls are related to accidents with a median call time of over an hour.
3.5% are related to enforcement with a median call time of just under 24 minutes.
Unfounded/Hangups:11.4% of all calls are hang-ups or are determined to be unfounded at a median call time of 0:17:31
Disturbances: 10.8% of all calls (47,734) are for various types of “disturbances” that include, among other subcategories, a variety of noise complaints.
Alarms: 4.3% of all calls for service (19,150) are generated from alarms. Of those calls, at least 65% are coded as false or cancelled.